

Every Monday, your leadership team asks the same questions: Which reps are winning, which campaigns are working, and where is revenue slipping through the cracks? Salesforce report formulas are the lens that turns scattered CRM records into answers. Summary Formulas roll up performance across thousands of opportunities or cases, while Row-Level Formulas catch issues on individual records, like mismatched regions or missing fields. Used well, they give sales and marketing leaders a live, trustworthy dashboard of the business.
The problem is that building and maintaining those formulas is still a very human chore—clicking through the Report Builder, tweaking fields, validating logic, cloning reports for every manager. Delegating this busywork to an AI agent means Salesforce reports are created, refreshed, and QA’d on autopilot. Instead of burning hours rebuilding the same win-rate or average deal-size formulas, your AI computer agent can log in, apply the right logic, validate results, and deliver ready-to-present dashboards while you focus on strategy.
Salesforce report formulas are the difference between “we think” and “we know.” But as your org grows, keeping those formulas accurate, standardized, and up to date becomes a grind. Let’s walk through practical ways to handle Salesforce report formulas—from hands-on to fully automated with AI agents—so you can choose the path that fits your team today and tomorrow.
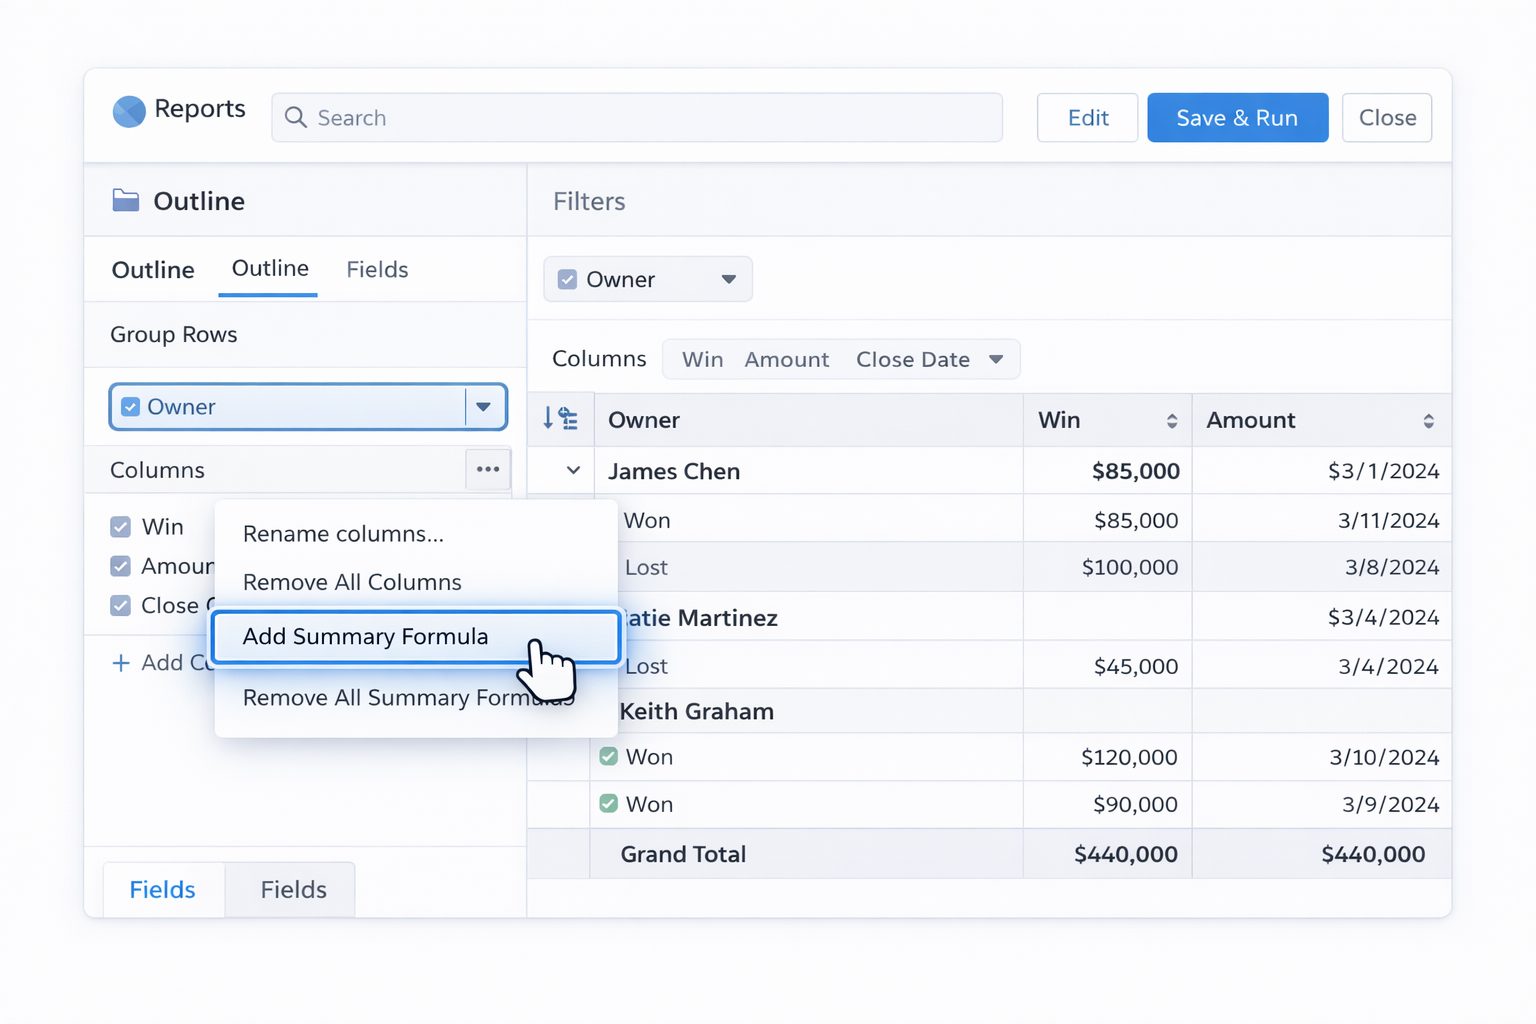
Summary Formulas calculate across multiple records (for example, average renewal amount or win rate).
Step-by-step:
AMOUNT:SUM / RowCountWON:SUM / CLOSED:SUMOfficial docs:
Row-Level Formulas compute on a single row (record). Great for checks like “Is Billing State equal to Shipping State?”
Step-by-step:
IF formula to compare fields. Example:IF(Account.BillingState = Account.ShippingState, 1, 0)Reference article (deep dive):
Often you don’t need a custom formula at all.
This keeps things simple and reduces formula sprawl.
Instead of reinventing the wheel:
Once a month, manually:
Pros (manual approaches): maximum control, low tech barrier. Cons: time-consuming, error-prone at scale, heavily dependent on one "Salesforce hero" in your org.
Even without coding, you can wrap some automation around your formulas to reduce manual effort.
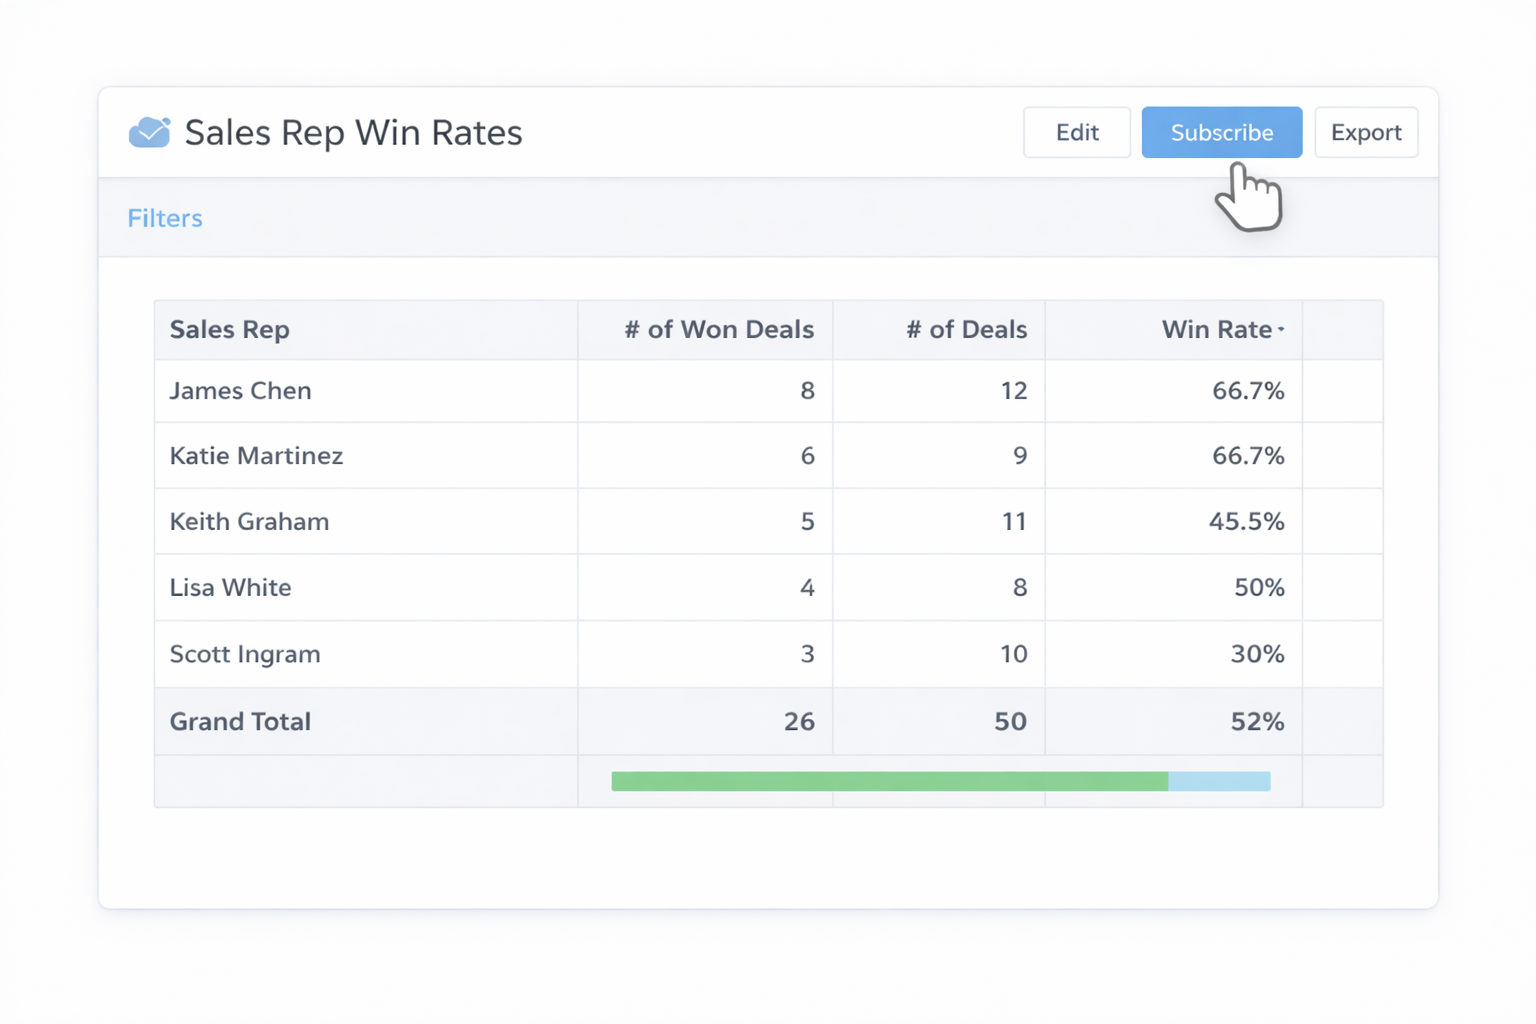
Subscriptions don’t build formulas, but they stop you from constantly re-running reports.
Docs: search "Report Subscriptions" in Salesforce Help: https://help.salesforce.com/s/
Create a folder like Global Sales Report Templates:
This no-code pattern standardizes formulas without extra tools.
Formulas are only as good as your data.
Better data → fewer "why is this formula wrong?" conversations.
For some marketing or finance teams, it’s easier to:
Pros (no-code): reduces repeated clicks, improves reuse, leverages native Salesforce features. Cons: still depends on humans to design and maintain formulas and report structures.
Manual and no-code approaches work—until they don’t. When you’re cloning variations of the same report for every region, product line, and manager, the overhead explodes. This is where an AI computer agent like Simular Pro can take over the "hands on keyboard" work.
Simular Pro (https://www.simular.ai/simular-pro) is a highly capable computer-use agent designed to operate your desktop, browser, and cloud tools the way a human would. That means it can:
Workflow:
WON:SUM / CLOSED:SUM) and the required filters.Pros: removes hours of repetitive clicking, guarantees formula consistency, easy to roll out updates globally. Cons: requires an initial setup and clear instructions, plus access management for the agent account.
Instead of manually spot-checking:
This turns QA from a quarterly panic into a quiet, continuous background process.
For recurring executive packs:
By connecting Simular Pro’s webhook integration to your existing pipelines (as described at https://www.simular.ai/simular-pro), you can trigger these runs after key events—month-end close, campaign launches, or board meetings.
Pros (AI agent): massive time savings, consistent execution, ability to handle workflows with thousands of steps. Cons: needs careful onboarding and permissions, and you’ll want a human to own the "reporting playbook" the agent follows.
When you blend the strengths of Salesforce’s native report formulas with Simular’s autonomous execution, you stop rebuilding the same logic and start treating reporting as an always-on service for your business.
Lorem ipsum dolor sit amet, consectetur adipiscing elit, sed do eiusmod tempor incididunt ut labore et dolore magna aliqua. Ut enim ad minim veniam, quis nostrud exercitation ullamco laboris nisi ut aliquip ex ea commodo consequat. Duis aute irure dolor in reprehenderit in voluptate velit esse cillum dolore eu fugiat nulla pariatur.
Block quote
Ordered list
Unordered list
Bold text
Emphasis
Superscript
Subscript
Think about the question you’re trying to answer. If it’s about a group of records (team performance, regional revenue, average case volume), use a Summary Formula. These calculate across multiple rows and show at the group or report level (for example, average renewal amount by country, or win rate by sales rep). To build one, open a summary or matrix report, click the Columns dropdown, select Add Summary Formula, choose your output type (Number, Percent, Currency), then insert fields such as Amount, Record Count, Won, or Closed. If your question is about an individual record (does this account’s Billing State match its Shipping State? is this opportunity flagged correctly?), choose a Row-Level Formula. In the report, click Add Row-Level Formula, pick an output type (Number or Checkbox is common), and use an expression like IF(Account.BillingState = Account.ShippingState, 1, 0). Use Summary Formulas for rollups; use Row-Level when you’re validating or tagging specific records.
A clean way to calculate win rate is with a custom Summary Formula. First, create or open an Opportunities report. In the Filters pane, set Opportunity Status = Closed so only Closed Won and Closed Lost records are included. Group the report by Owner or Team to see win rate by rep or group. Next, go to Outline → Columns → Add Summary Formula. Name it something like Win Rate, set Output Type = Percent, and Decimal Places = 2. In the formula editor, insert the Won field (or a 1/0 won indicator), set it to Sum, then divide by the Closed count, also set to Sum, for example: WON:SUM / CLOSED:SUM. Click Validate, then Apply, and finally Run the report. Optionally, turn off detail rows so you see just the win rate by rep. For a step-by-step walkthrough, follow Salesforce’s Trailhead unit on summary formulas: https://trailhead.salesforce.com/content/learn/projects/create-reports-and-dashboards-for-sales-and-marketing-managers/use-summary-formulas-in-your-reports.
Row-level formulas are perfect for spotting dirty data without creating extra fields on objects. Start by building a report on the object you care about (for example, Cases or Opportunities). In the report builder, open the Columns dropdown and choose Add Row-Level Formula. Decide what you want to check. For address consistency, you might compare Account.BillingState and Account.ShippingState. Choose Output Type = Number or Checkbox. If using Number, a common pattern is IF(Account.BillingState = Account.ShippingState, 1, 0) so that 1 means "ok" and 0 means "mismatch". If you prefer a text explanation, use Output Type = Text with IF(Account.BillingState = Account.ShippingState, "Match", "Mismatch"). Add the formula column to the report and run it. You can filter on the mismatch value to see only problematic records. Once you’ve identified the issues, you can either fix them manually or feed the report into a data cleanup process or an AI agent like Simular to bulk-correct records.
Treat formulas like products, not one-off hacks. Start by defining a set of **canonical formula reports**: for example, Pipeline by Stage, Win Rate by Rep, Average Case Resolution Time, and MQL→SQL conversion. Build each report carefully with validated Summary and Row-Level Formulas. Save them into a dedicated folder, such as **Global Sales Report Templates**, and restrict edit rights so only your RevOps or admin team can change them. Publish a simple internal guide describing what each report is for, which fields it uses, and how the formulas work. Then train teams to click **Save As** when they need a variant, changing only filters (region, product, timeframe) and not the core formulas. For global consistency, periodically audit reports: list all reports in use, compare their formulas to your templates, and correct any drift. An AI computer agent like Simular can even automate this audit by opening each report, reading the formulas, and logging any differences for you to review.
First, stabilize your logic inside Salesforce: make sure key formula reports (like executive pipeline, win rate, and churn risk) are configured correctly and stored in a known folder. Next, use **report subscriptions** so sales and marketing leaders get the latest numbers on a schedule without manually running anything—open the report, click **Subscribe**, define the cadence, recipients, and optional conditions (for example, only send if pipeline drops below a threshold). To truly scale, bring in an AI computer agent such as **Simular Pro**. Because it can operate your browser and desktop like a human, you can instruct it to log in to Salesforce, clone/update reports for each region or segment, adjust date filters, validate formulas, and export or email results. With Simular’s transparent execution and webhook integration (see https://www.simular.ai/simular-pro), you can trigger these multi-step workflows after key events (month-end, campaign launch) and trust that hundreds of formula-heavy reports will be refreshed and delivered without extra manual effort.