

Every strong strategy has two halves: deciding where you are going, and making sure the plan actually survives contact with reality. Strategic planning timeline templates bridge that gap. They turn vague intentions into dated milestones, owners, and dependencies spread across months or years. In Google Sheets or Excel, you can align vision, annual goals, and marketing or product campaigns into a single visual path that everyone sees.But these templates only work if they stay current. That is where an AI computer agent changes the game. Instead of leaders chasing updates, the agent lives inside your existing tools: opening Sheets and Excel files, adjusting dates as projects slip, rolling up progress, and flagging risks before your quarterly review. Delegating timeline maintenance to an AI agent means your team spends less time nudging cells and more time debating real strategic choices.Now imagine the same agent waking up every Monday, scanning CRM and project tools, refreshing your Google Sheets and Excel timelines, and emailing a crisp summary to your leadership team. No pings, no chasing. Just a living roadmap, continuously updated in the background by an AI partner that never gets tired of dates, dependencies, and status fields.
### 1. Manual ways to build a strategic planning timelineIf you are just getting started or running a small team, the classic manual workflow in Google Sheets and Excel is enough. Here is a simple, repeatable approach:**Step 1: Define your planning horizon and levels** Decide if your timeline is annual, 3 year, or 5 year. Then list what you will track: company objectives, departmental OKRs, key projects, and major campaigns.**Step 2: Build your structure in Google Sheets** 1. Create a new Sheet and add columns such as: Year, Quarter, Month, Initiative, Owner, Start Date, End Date, Status, KPI, Notes. 2. Turn the header row into a filter view for easy slicing. 3. Use data validation for Status (Not started, In progress, At risk, Done) so your team stays consistent. 4. Use conditional formatting to color code statuses across the timeline. 5. For more help, explore the Google Sheets Help Center: https://support.google.com/docs**
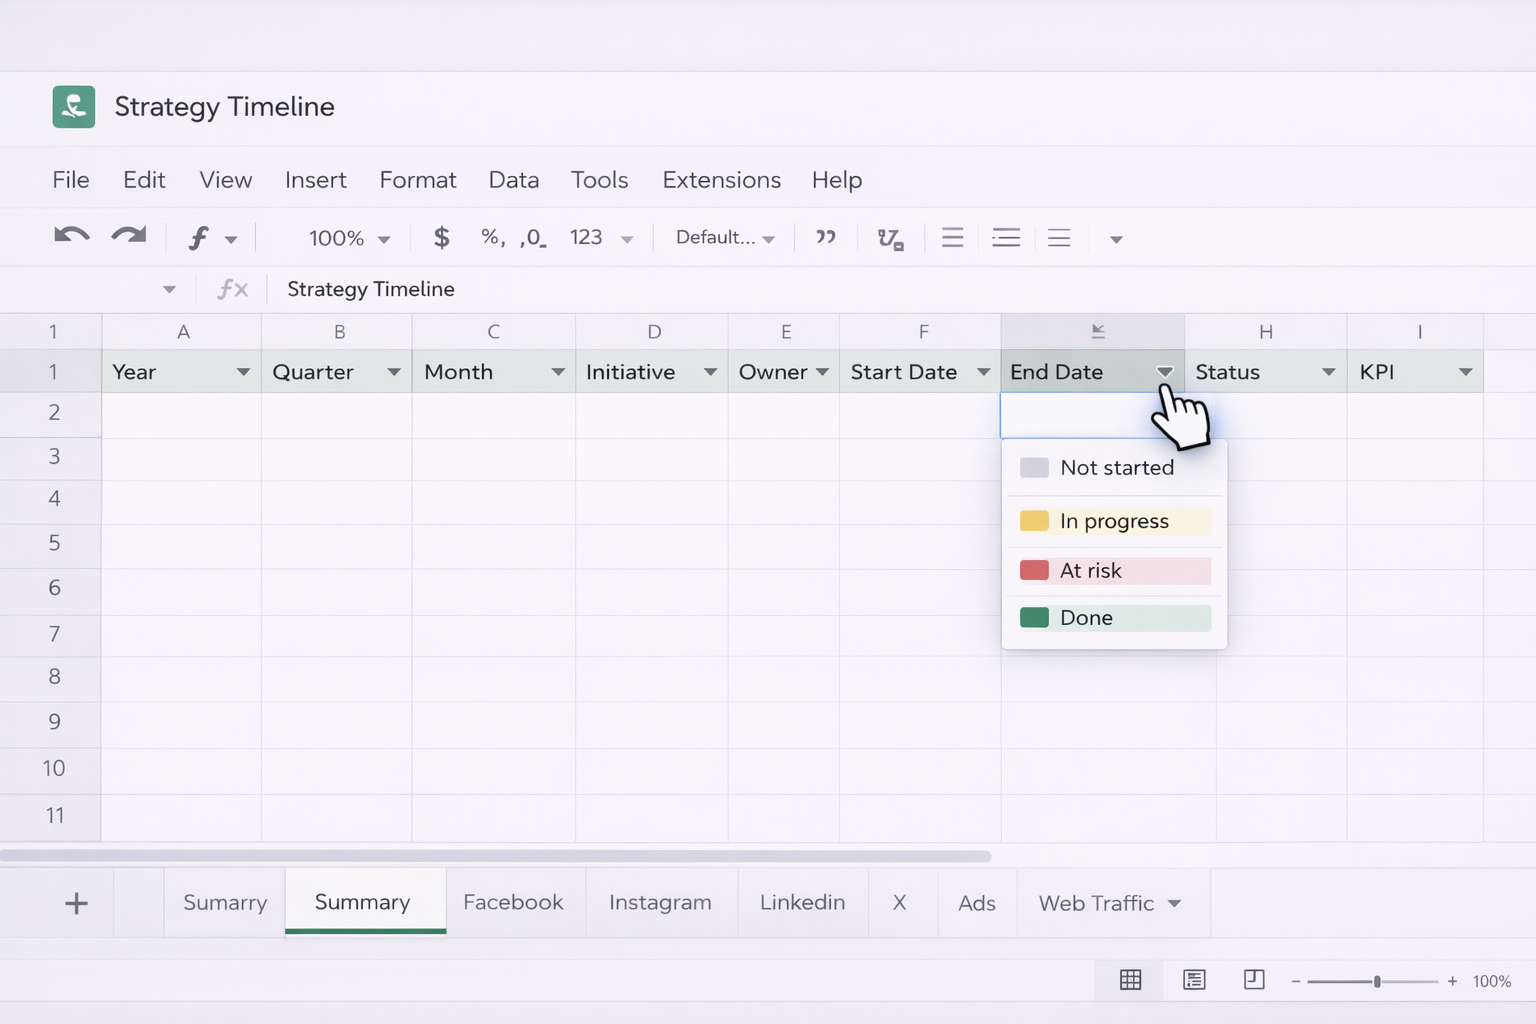
Step 3: Create a visual timeline in Sheets** 1. Insert a new sheet called Timeline. 2. In rows, list your initiatives. In columns, list weeks or months. 3. Use formulas like =AND(date>=start_date, date<=end_date) to fill bars for active periods, then apply conditional formatting to highlight them.**Step 4: Mirror or extend in Excel** If finance or operations lives in Excel, mirror key parts of the timeline there: 1. Add a table with the same columns as your Google Sheet. 2. Use Excel tables and filters to group by owner or department. 3. Use conditional formatting and bar styles to visually show duration. 4. Optionally, build a Gantt style chart from your Start and End Date fields using stacked bar charts. Learn more in Excel support: https://support.microsoft.com/excel**Step 5: Run a recurring review cadence** Set a monthly or quarterly meeting where leaders walk through the timeline, update statuses, and adjust dates. This is still manual, but it forces alignment and better decisions.---### 2. No code automation to keep timelines updatedManual works until you are drowning in projects. The next step is layering simple, no code automation on top of your Google Sheets and Excel templates.**Approach A: Form based intake into Google Sheets** 1. Turn your timeline sheet into the single source of truth. 2. Create a Google Form that captures new initiatives: Name, Owner, Start, End, Goal, KPI. 3. Link the form responses directly to your timeline spreadsheet. 4. Use array formulas to pull new rows into your visual timeline tab automatically. Now project leads can submit new work without touching the core template, while you maintain structure.**Approach B: Connect project tools to Sheets** 
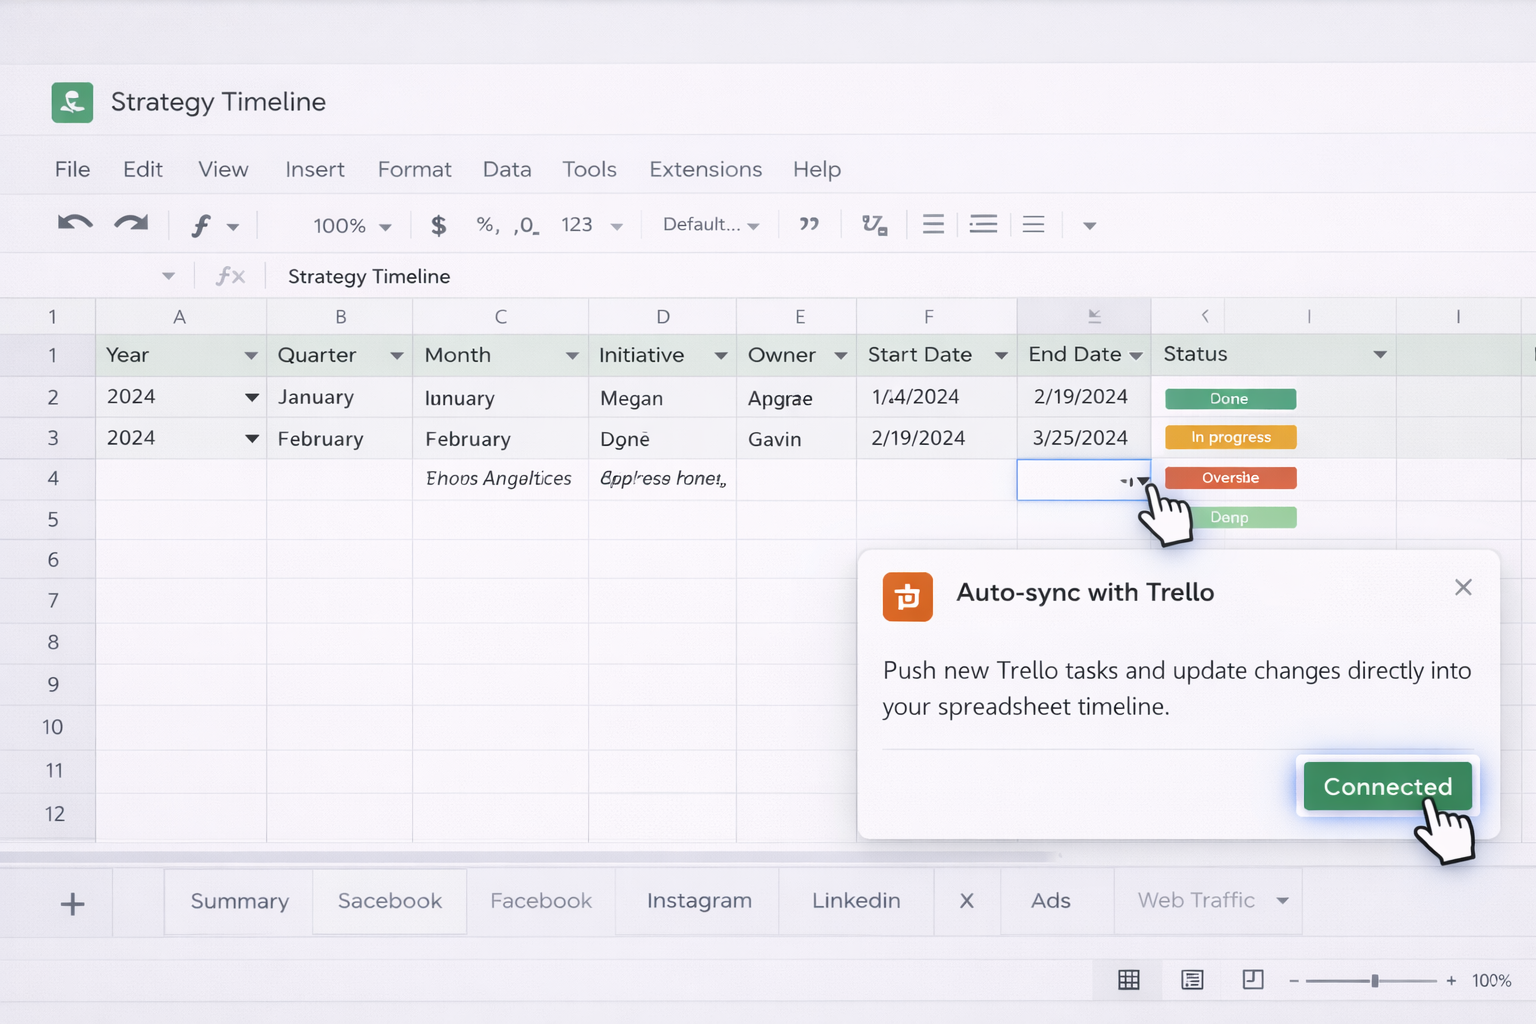
If you manage work in tools like Asana, ClickUp, or Trello, use their native Google Sheets integrations or Zapier/Make to: - Push new tasks or projects into your Sheets timeline when they are created. - Update status or due dates in Sheets when things move in the project tool. Your timeline starts tracking reality without manual copy pasting.**Approach C: Sync Excel with source systems** For teams that live in Excel, use Power Query or connectors to pull data from your CRM, ERP, or data warehouse: - Import pipeline milestones or revenue targets by quarter. - Map them against your strategic initiatives table. - Refresh the query before key reviews so your Excel timeline has up to date metrics.**Pros of no code automation** - Eliminates most re typing and data entry. - Keeps timelines closer to real execution systems. - Still understandable and debuggable by non engineers.**Cons** - Integrations can break when schemas change. - You still need humans to resolve conflicts, adjust dates, and communicate impact. - Hard to scale beyond a few core templates before it becomes messy.---### 3. Scaling timelines with an AI computer agentOnce your Google Sheets and Excel templates are in place, an AI computer agent lets you operate them like a virtual strategy operations assistant.**Method 1: Let the agent maintain the master timelines** You define the rules: how often to check, where to look, and what changes are allowed. The AI agent then:- Opens your Google Sheets timeline, scans each row for out of date statuses or dates that are in the past. - Logs into your CRM or project tool in the browser, checks actual progress, and adjusts the Sheet accordingly. - Mirrors critical updates into an Excel workbook used for board reporting. - Adds comments on rows that look risky, such as timelines slipping past key events.**Pros** - Offloads all the mechanical timeline hygiene work. - Works across desktop, browser, and cloud tools without new APIs. - Every action is visible in your Sheets and Excel files.**Cons** - You need to spend time upfront to define clear operating instructions. - Best for recurring, structured planning cycles rather than one off experiments.**Method 2: Use the agent as a strategic planning co pilot** Here the AI computer agent is not just maintaining dates; it is orchestrating the planning ritual:- Before your quarterly offsite, the agent compiles last quarter performance from Excel dashboards and campaign data from Sheets. - It updates your strategic planning timeline templates, rolls forward goals, and drafts a summary of what slipped, what accelerated, and where capacity is tight. - It exports fresh PDFs or presentation ready views for the leadership team.You then use the session to make decisions, while the agent handles the prep and post meeting updates.**Method 3: Always on scenario testing** At a more advanced stage, you can ask the agent to run what if simulations: - Duplicate your Excel timeline into a sandbox workbook. - Shift date ranges for specific initiatives by 30 or 60 days. - Recalculate resource or budget implications based on formulas already built into your sheets. - Save multiple scenarios and generate a comparison summary in Google Sheets.This blend of manual structure, light no code automation, and a capable AI computer agent lets business owners, agencies, and marketing or sales leaders maintain strategic planning timelines that are both rigorous and remarkably low touch.
Lorem ipsum dolor sit amet, consectetur adipiscing elit, sed do eiusmod tempor incididunt ut labore et dolore magna aliqua. Ut enim ad minim veniam, quis nostrud exercitation ullamco laboris nisi ut aliquip ex ea commodo consequat. Duis aute irure dolor in reprehenderit in voluptate velit esse cillum dolore eu fugiat nulla pariatur.
Block quote
Ordered list
Unordered list
Bold text
Emphasis
Superscript
Subscript
Start by deciding your planning horizon: 1, 3, or 5 years. In Google Sheets or Excel, create a table with columns such as Strategic Objective, Initiative, Owner, Start Date, End Date, Quarter, Status, and KPI. Add a second sheet named Timeline that lists periods (months or quarters) in columns and initiatives in rows.Next, link the two views. In the table sheet, maintain the single source of truth. In the timeline sheet, use formulas to check if each period falls between Start Date and End Date, and display a marker or bar when it does. This gives you both a data view and a visual view. Finally, group initiatives by theme or department using filters or pivot tables, so a marketing leader can see their stream while the CEO sees the whole portfolio. Save this as a template file so every new planning cycle starts from the same structure.
Centralize your strategy timeline in one master Google Sheet whenever collaboration is critical. Store it in a shared Drive folder with edit access for owners and comment access for stakeholders. Use protected ranges to lock down formulas and structural elements while allowing teams to edit only their assigned rows (for example, each department’s initiatives).Add a Notes or Latest Update column so owners log changes instead of quietly adjusting dates. Turn on version history so you can roll back if someone breaks the structure. For Excel heavy teams, keep the master in OneDrive or SharePoint, enable co authoring, and set clear rules about when to update. Pair this with a recurring meeting where the team reviews the Sheet live, making edits in real time. Over time, you can delegate recurring hygiene tasks (status refreshes, date nudges) to an AI agent, while humans focus on discussions inside the file.
Begin by listing your key KPIs for the planning period: revenue, leads, activation rate, churn, or campaign metrics. In your Google Sheets or Excel timeline table, add KPI Target and KPI Actual columns for each initiative. Link KPI Actual to underlying data where possible: for example, use an IMPORTRANGE or connector sheet that pulls metrics from your CRM or analytics into a data tab.Then, use SUMIFS or similar functions to aggregate KPI Actual by quarter or year for each objective. Create a dashboard tab that charts these aggregates against the dates in your strategic timeline. This turns your roadmap into a living scorecard, not just a date tracker. As you mature, an AI computer agent can refresh the data imports, recompute the aggregates, and flag objectives that are off track, so leadership walks into reviews with numbers already tied to the roadmap.
At minimum, update your strategic planning timeline monthly; for fast moving agencies or growth teams, weekly updates are ideal. Ownership should be explicit. Assign a Strategy Operations or RevOps style owner who governs the structure of the Google Sheets or Excel template, maintains definitions, and ensures data hygiene.Each department or squad then owns their slice of the timeline: they are responsible for keeping status, dates, and KPIs current. To reduce friction, pair the human owner with an AI agent that performs pre meeting cleanup: it checks for overdue items, prompts owners via comments, and rolls forward slipped milestones. This shared model keeps the roadmap accurate without burying one person in manual updates.
Start small and transparent. First, document your current manual process in detail: which Google Sheets and Excel files you touch, what changes are allowed, and what checks you perform before saving. Then configure your AI computer agent to operate only on copies of those files at first. Observe its execution traces, refine the instructions, and confirm it makes the same edits you would.Next, move to a supervised mode on live files: the agent proposes updates (for example, suggested new dates or statuses) via comments or a separate Suggestions sheet. Human owners review and approve. Once trust is established, you can let the agent apply low risk edits automatically, like rolling forward overdue tasks or updating simple status fields, while still requiring human approval for structural changes or major re sequencing. By phasing responsibility this way, you gain leverage from automation without surrendering strategic control.