Oops! Something went wrong while submitting the form.
How to build social dashboards in Google Sheets & Excel
A practical guide to building social media dashboards in Google Sheets and Excel, then handing updates to an AI computer agent so reporting runs itself every week.
Every marketer knows the feeling: five browser tabs open, screenshots everywhere, and a weekly reporting deadline creeping closer. A social media dashboard template cuts through that chaos by pulling channel metrics, audience data, and content performance into a single view. Instead of hopping between Facebook, Instagram, LinkedIn, TikTok, and YouTube, you review one clean sheet, compare posts and campaigns side by side, and immediately see what is working.
Templates in Google Sheets and Excel give you a repeatable frame: predefined tabs for channels, unified KPI definitions, and charts that auto update when new data lands. They make social performance visible for founders, sales teams, and clients without anyone touching the raw platforms.
Now add an AI computer agent to this picture. Instead of you exporting CSVs, pasting values, and refreshing charts, the agent logs into each platform, downloads the latest data, cleans it, and feeds your Google Sheets or Excel template on a schedule. It becomes a quiet operations teammate: you spend Monday deciding what to do with the numbers, not fighting to collect them.
How to build social dashboards in Google Sheets & Excel
1. Manual ways to build a social media dashboard
1.1 Start with a metrics map
Before you touch a spreadsheet, list the questions you care about:
Which channels matter now (Facebook, Instagram, LinkedIn, X, TikTok, YouTube)?
What outcomes matter (leads, sales, sign ups, website visits)?
Which leading indicators predict those outcomes (reach, CTR, saves, video watch time)?
Turn this into a small metrics map on paper: Channel → KPI → Goal. This becomes the backbone of your dashboard template.
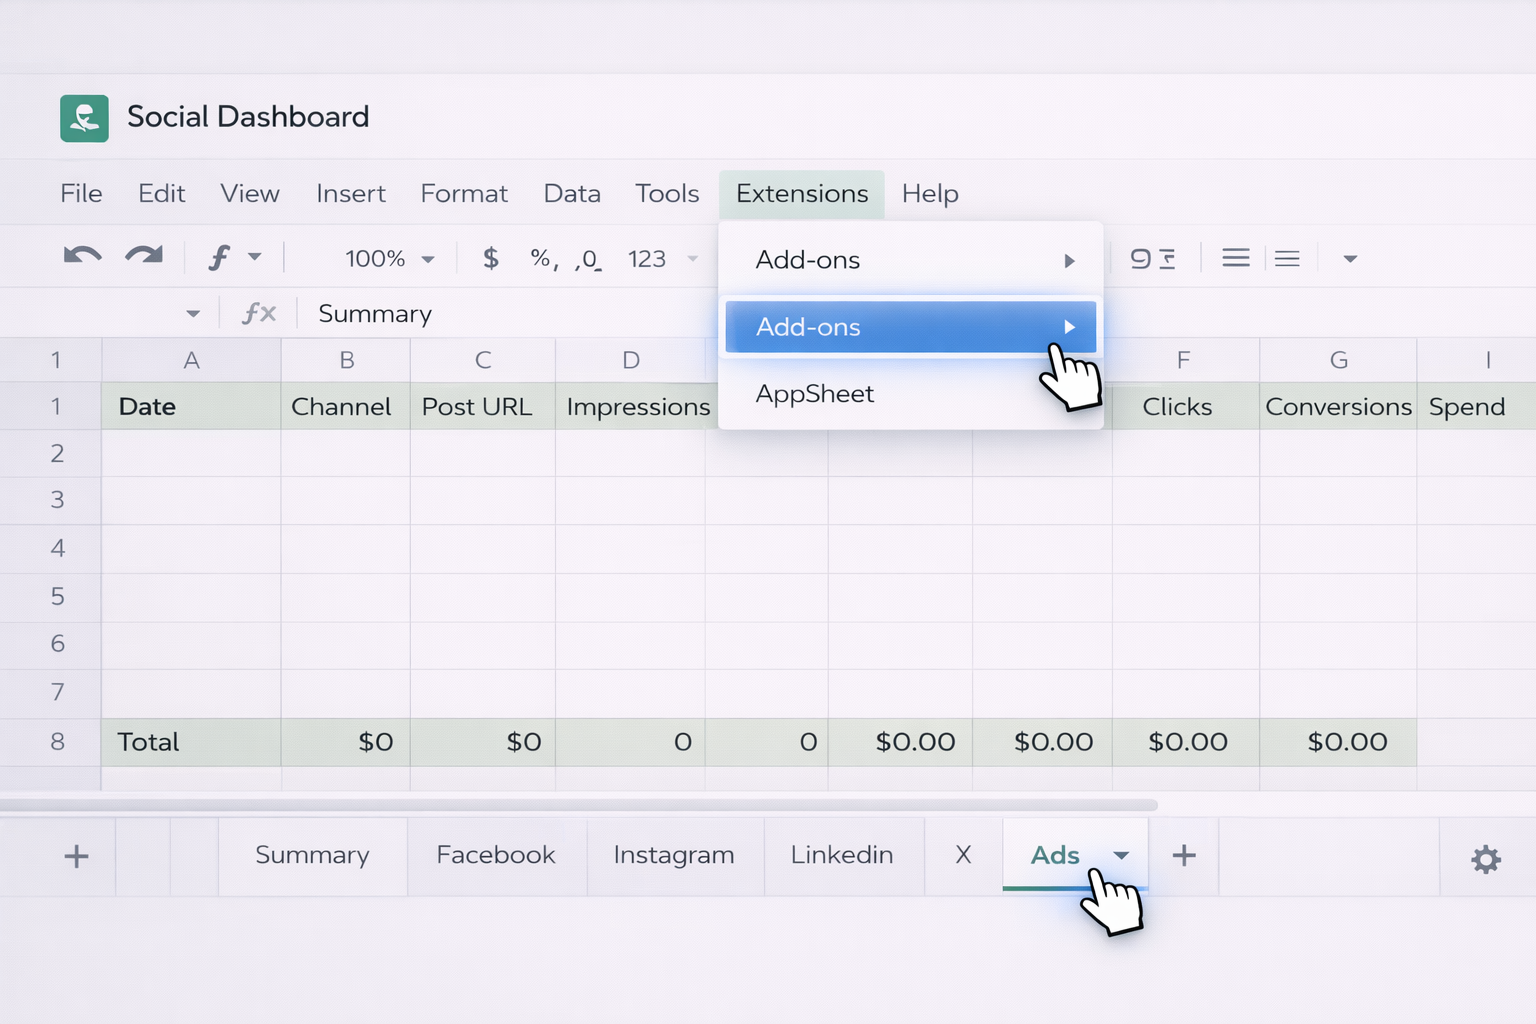
1.2 Build a Google Sheets dashboard manually
Create a new spreadsheet in Google Sheets.
Add separate tabs: Summary, Facebook, Instagram, LinkedIn, X, Ads, Web Traffic.
On each channel tab, define column headers such as Date, Campaign, Post URL, Impressions, Reach, Clicks, CTR, Conversions, Spend.
Each week, export CSV reports from each platform and paste them into the matching tab.
Use simple formulas to surface key stats on the Summary tab, for example:
Total impressions: =SUM(Facebook!D:D, Instagram!D:D, LinkedIn!D:D)
Pick a fixed time each week to export, paste, and refresh.
Capture insights in a Notes section on the Summary tab.
Save a copy per week so you can look back at performance trends.
Pros of manual methods
Full control and deep familiarity with your data.
No tooling cost; perfect for very small teams.
Cons
Time consuming and error prone.
Easy to skip weeks when you are busy, breaking your history.
2. No code automation with mainstream tools
2.1 Use Google Sheets with native and add on connectors
Many teams graduate from copy paste to connectors.
Keep your existing Google Sheets template structure.
Use built in functions like IMPORTXML or IMPORTDATA where possible to pull simple public metrics.
For richer data, plug in no code connectors (from vendors like Coupler, Catchr, or Databox) that sync Facebook, Instagram, LinkedIn, TikTok, and YouTube directly into specific tabs.
Configure schedules so data refreshes daily or hourly.
On the Summary tab, build all charts and KPIs on top of these synced ranges.
The big advantage: your dashboard updates itself without you exporting CSVs. You still design formulas and visuals, but the data movement is automated.
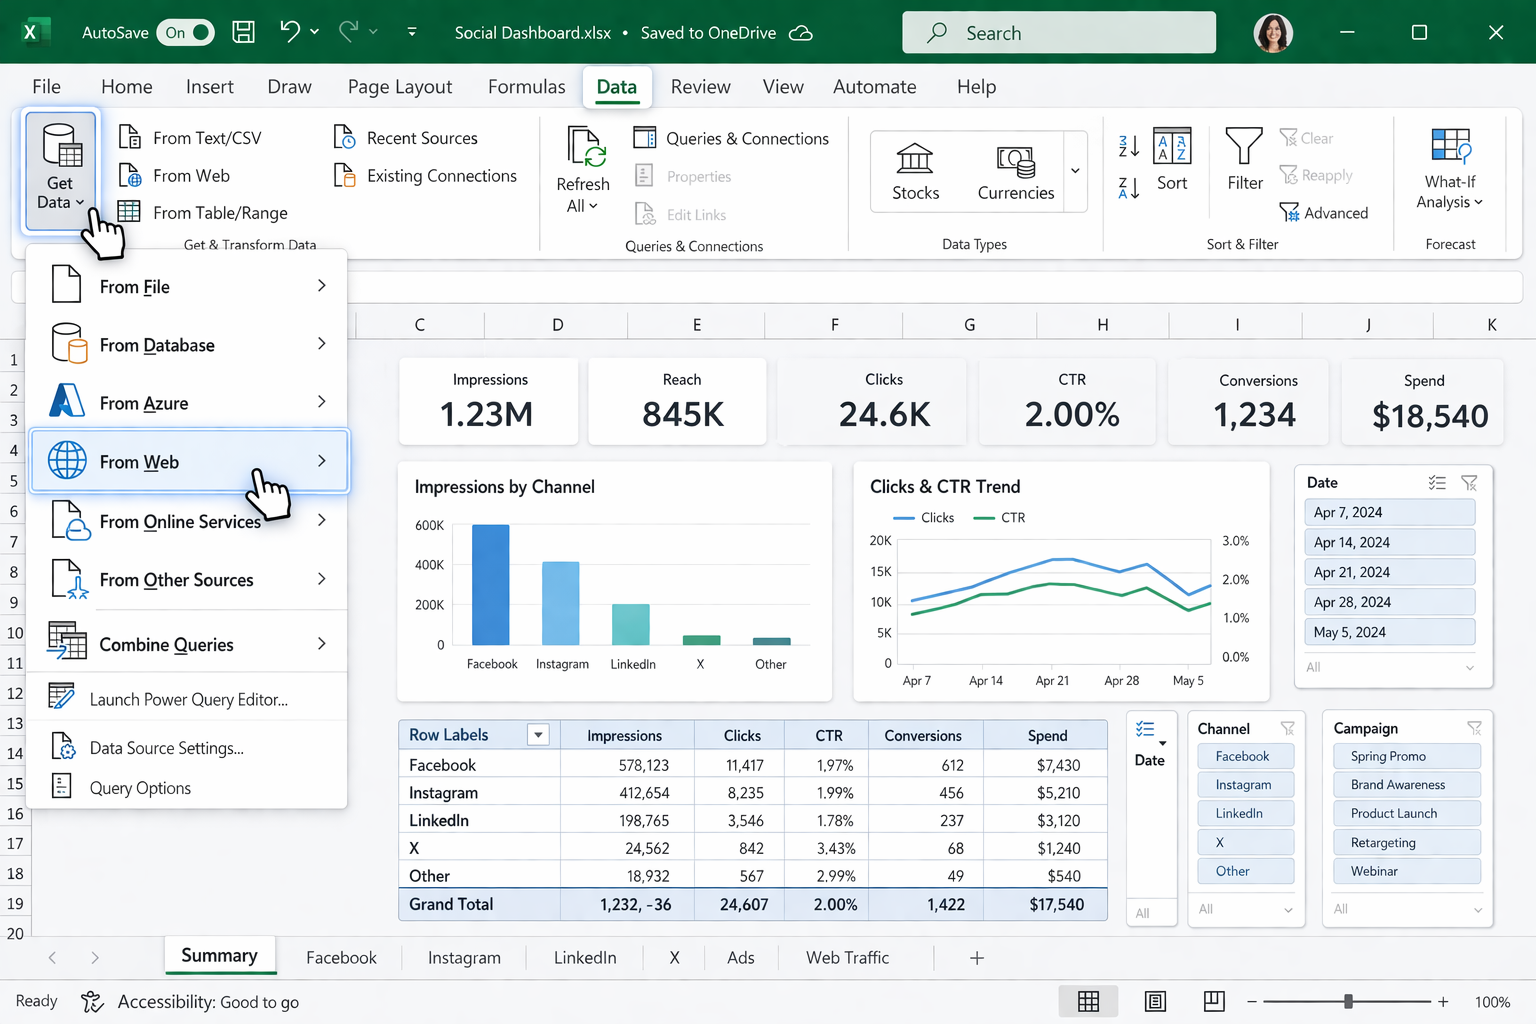
2.2 Connect Excel to online sources
Excel can also tap into APIs and online services.
Store your workbook in OneDrive or SharePoint so it can refresh online.
Use Data → Get Data → From Web or From Online Services where available.
For platforms without native connections, create CSV feeds or use Power Query to ingest shared files.
Use PivotTables, charts, and Slicers so stakeholders can filter by date, channel, and campaign.
Automatically pull previous days metrics at 7 am so leadership has a fresh view before stand up.
Update a client facing Google Sheets dashboard every Monday before status calls.
Sync only key KPIs (impressions, clicks, conversions, spend) to keep your dashboards fast.
Pros of no code automation
Huge time savings on data collection.
Still accessible to non developers.
Cons
You are limited by what connectors expose.
Complex multi step workflows can get brittle across many tools.
3. Scaling with AI agents as your reporting team
This is where an AI agent like Simular Pro starts to feel like a new hire on your marketing team.
3.1 Let the AI agent operate your browser and desktop
Simular Pro is a computer use agent: it can click, type, and navigate your desktop and browser the way a human would. A typical social dashboard workflow looks like this:
You record or describe a playbook: log into Facebook Ads, filter last 7 days, export performance CSV, save it to a folder.
The agent repeats this for each network, then opens Google Sheets or Excel.
It pastes or imports the new data into the right tabs, runs your existing formulas, and refreshes charts.
Finally, it exports a PDF snapshot or sends a link to your team.
Because every action is transparent and inspectable in Simular Pro, you can review exactly what it did and tweak steps as needed.
3.2 Use web data extraction to enrich dashboards
Beyond first party metrics, you can have the agent:
Scrape competitor profiles, pulling follower counts or engagement into a Competitors tab.
Collect top performing YouTube videos or tweets and log their URLs and stats into Google Sheets.
Combine on platform metrics with website behaviour from your analytics tools.
Manually, this would take hours. The agent runs the same multi step process every week with production grade reliability, handling thousands of actions without fatigue.
3.3 Integrate dashboards into wider workflows
Simular Pro also plugs into your existing pipelines via webhooks.
Examples:
When a new campaign is launched in your CRM, trigger the agent to create matching rows in your Sheets or Excel dashboard.
After updating the weekly dashboard, have the agent generate a short written summary and email it to stakeholders.
Pros of AI agent automation
End to end automation: not just data movement, but logging in, exporting, cleaning, and reporting.
Flexible: if a UI changes, you can visually correct the flow instead of waiting for a connector update.
Scales to many brands or clients without adding headcount.
Cons
Requires initial setup time to design and test the agent workflow.
As with any powerful system, you need governance: access controls, clear naming, and monitoring.
Used well, your social media dashboard template in Google Sheets or Excel becomes the stage, and your AI agent is the crew working behind the scenes, so you and your team can stay focused on creative strategy and revenue.
Scale social dashboards with an AI agent co-pilots
Onboard the AI agent
Set up your Simular AI agent with access to Google Sheets and Excel, record how you open your dashboard file, refresh data, and update charts so the agent learns your exact flow.
Test & refine runs
Run Simular Pro on a single reporting cycle. Watch every transparent step, fix column mismatches, adjust filters, and verify your social dashboard updates correctly the first time.
Scale delegated runs
Schedule Simular AI Agent to refresh Google Sheets and Excel dashboards for all brands, trigger via webhook, and let it handle hundreds of exports and updates while you focus on strategy.
Learn how to automate Google Sheets
Google Sheets is your live hub for social media dashboards, pulling metrics into sharable, filterable views your team can explore from any browser in real time.
Excel turns raw social exports into structured, presentation ready dashboards with PivotTables, charts, and formulas tailored for deeper campaign and ROI analysis.


.svg)