How to build market cap calculator in Sheets & Excel

Build a live market cap calculator in Google Sheets and Excel, then let an AI computer agent fetch prices, update caps, and surface insights for your team.
Advanced computer use agent
Production-grade reliability
Transparent Execution

Why Sheets & Excel + AI

Market cap is the quick pulse check on any asset: one number that blends current price and total supply into a clear sense of size, risk, and upside. For founders, agency owners, and marketers managing treasuries, client portfolios, or token experiments, a market cap calculator in Google Sheets or Excel becomes the control tower. You compare competitors, sanity-check valuations, and model what happens if a price or supply changes.The basic math is simple—price × shares—but doing it across dozens of stocks, tokens, or “what if” scenarios gets messy fast. Live feeds break. Columns drift. Someone overwrites a formula five minutes before a pitch.That’s where delegating to an AI agent stops being a luxury and becomes operational hygiene. Let the AI computer agent handle the repetitive work: pulling fresh prices, reconciling tickers, updating Sheets and Excel tabs, and flagging anomalies. You stay focused on the narrative—why this asset matters—while your agent quietly keeps the numbers clean, current, and always ready for the next decision.

How to build market cap calculator in Sheets & Excel

# How to Build and Scale a Market Cap Calculator## 1. Manual methods in Google Sheets and Excel### 1.1 Google Sheets: basic market cap calculator**Goal:** Calculate market cap for a list of tickers using live data.1. Create a new Sheet and add headers in row 1: `Ticker`, `Price`, `Shares`, `Market Cap`.2. In column A, list your tickers, e.g. `AAPL`, `GOOG`, or `BTC-USD`.3. In cell `B2`, pull the latest price using `GOOGLEFINANCE`: ``` =GOOGLEFINANCE(A2, "price") ```4. In column C, enter the number of outstanding shares (for stocks) or circulating supply (for tokens).5. In cell `D2`, calculate market cap: ``` =B2 * C2 ```6. Drag formulas in B2 and D2 down to fill all rows.If you’re new to GOOGLEFINANCE, see Google’s official help: https://support.google.com/docs/answer/3093281**Pros:** Free, fast, great for small lists. **Cons:** Limited coverage for some assets, occasional data delays.### 1.2 Google Sheets: scraping prices from the web
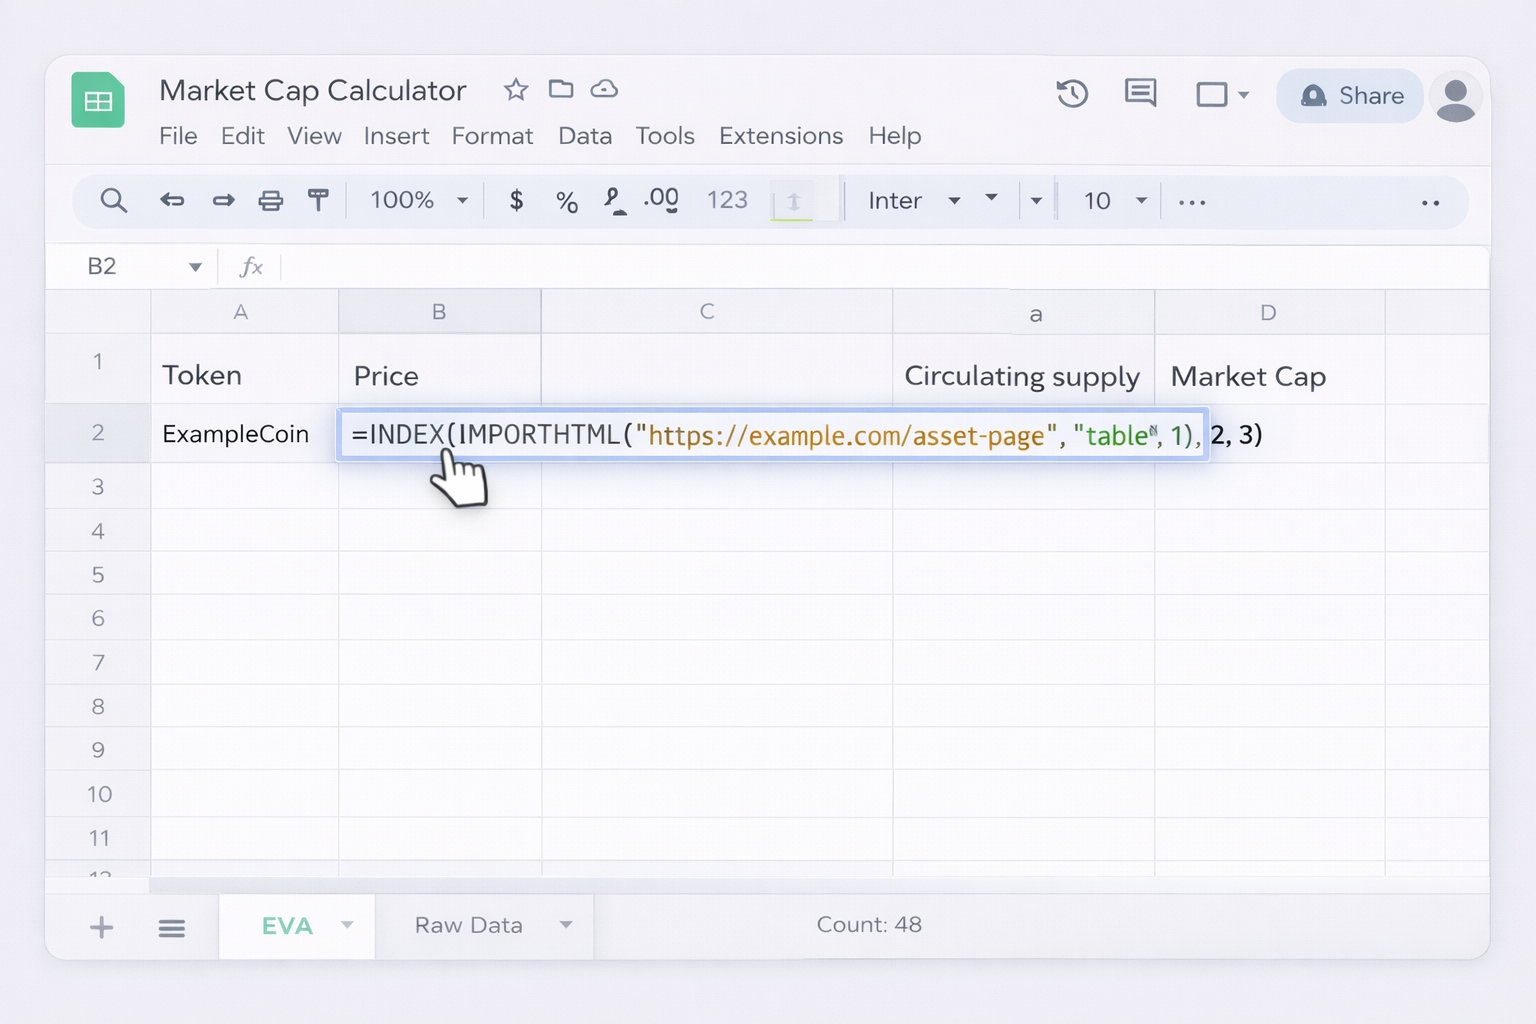
For obscure tokens or OTC assets, you may need to scrape.1. Find a reliable page with a simple price table (e.g., a crypto listing site). 2. In `B2`, use `IMPORTHTML`: ``` =INDEX(IMPORTHTML("https://example.com/asset-page", "table", 1), 2, 3) ``` Adjust table and row/column indices to point to the price cell.3. Multiply as before: `=B2 * C2`.Docs for IMPORTHTML: https://support.google.com/docs/answer/3093339**Pros:** Works where APIs don’t. **Cons:** Breaks if the website layout changes; needs maintenance.### 1.3 Excel: manual market cap calculator**Goal:** Same idea, but inside Excel.1. Create headers: `Ticker`, `Price`, `Shares`, `Market Cap` in row 1.2. Fill column A with tickers.3. In Excel for Microsoft 365, select cells in column A, then on the **Data** tab choose **Stocks** to convert tickers into linked data types. Official guide: https://support.microsoft.com/en-us/office/stock-quotes-in-excel-445b70ea-9a4d-4f32-ae24-9d52ba4d0f084. Once converted, click the **Insert Data** button that appears, and add the **Price** field to column B.5. Manually enter `Shares` in column C.6. In `D2`, use `=B2 * C2` and copy down.**Pros:** Native stock data, easy for corporate users. **Cons:** Requires proper licensing; doesn’t cover every crypto.### 1.4 Excel: pulling prices via web queries (Power Query)1. Go to **Data > Get Data > From Other Sources > From Web**. 2. Paste a URL with a clean price table (e.g., an exchange or finance site). 3. Use the Power Query editor to select the table and load it into a worksheet. 4. Map the imported price column to your tickers and compute market cap with `Price * Shares`.Docs: https://support.microsoft.com/en-us/office/import-data-from-external-data-sources-power-query-0d2be0b2-5450-4d30-accb-95cdedf1e5a6**Pros:** Robust for web data, good for larger lists. **Cons:** Initial setup is less intuitive, refresh logic must be managed.---## 2. No-code automation with toolsOnce your basic calculator exists, the bottleneck becomes **refreshing** data and **logging** changes. No-code tools can keep Google Sheets and Excel up-to-date without manual clicks.### 2.1 Zapier: automate inputs and snapshots
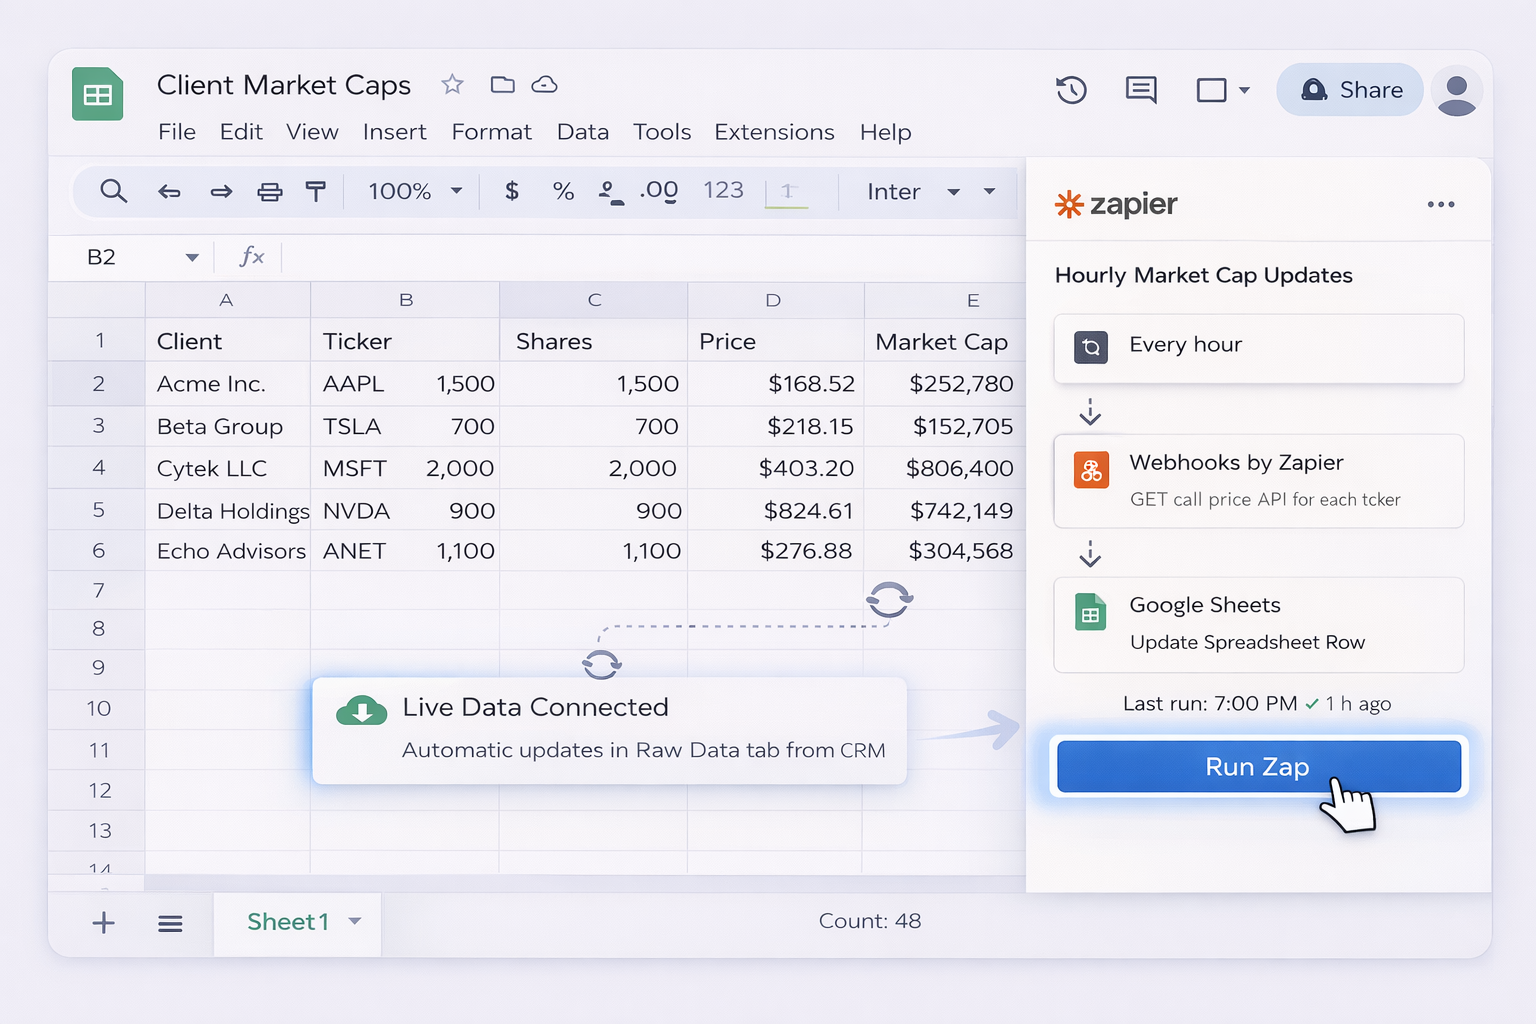
Imagine you run an agency managing multiple client portfolios.1. Create a Google Sheet template with columns for `Client`, `Ticker`, `Shares`, `Price`, `Market Cap`, `Snapshot Time`.2. In Zapier, set a **Schedule** trigger (e.g., hourly). 3. Add an action **Webhooks by Zapier > GET** to call a price API (or a service like MarketCapOf) for each ticker. 4. Write the response back to Google Sheets with **Update Spreadsheet Row**. Docs: https://support.google.com/docs/answer/63881025. Let Sheets handle `=Price * Shares` for market cap.**Pros:** No code, repeatable, works well for Sheets. **Cons:** Cost scales with tasks; handling many tickers per run can get complex.### 2.2 Make (Integromat): complex multi-asset flows1. In Make, create a scenario triggered on a time schedule. 2. Add modules to fetch prices from multiple APIs (stocks, crypto, FX). 3. Branch by asset type, normalize into a single data structure. 4. Push updates to **Google Sheets** or **Excel Online (Business)** connectors.**Pros:** Visual, powerful branching and mapping. **Cons:** Higher learning curve; debugging mis-mapped fields takes time.### 2.3 Apps Script / Office Scripts for power usersIf you’re comfortable with light scripting:- In **Google Sheets**, use Apps Script to loop through tickers, hit APIs, and write prices and caps. Docs: https://developers.google.com/apps-script/guides/sheets- In **Excel**, use Office Scripts or VBA to refresh data ranges and recalc caps automatically.**Pros:** Flexible and cheap at scale. **Cons:** Requires basic coding; scripts must be maintained.---## 3. Scaling with AI agents (Simular) at desktop levelNo-code solves API wiring, but someone still has to patch broken imports, log into new data sources, and fix Sheets and Excel when formats change. That “someone” can be a Simular AI agent instead of a human.### 3.1 AI agent as your market data operatorWith Simular Pro, you can spin up an autonomous computer-use agent that behaves like a meticulous analyst:1. Give the agent a clear goal: “Every morning, open these Google Sheets and Excel workbooks, fetch latest prices from MarketCapOf / MarketBeat / exchanges, recompute market cap, and log changes.”2. The agent opens your browser, navigates to the data sites, copies prices, and pastes them into the right cells—exactly as a human would. 3. It runs through dozens or hundreds of rows, triggering built-in formulas (`=B2*C2`) as it goes.**Pros:** No dependency on brittle APIs; works across web, Sheets, Excel, and desktop apps. **Cons:** Requires initial setup and testing; runs consume compute time.### 3.2 Agents maintaining multi-client workbooksFor agencies and consultancies:1. Organize one workbook per client with a consistent layout. 2. Configure a Simular agent run per client or per segment (e.g., DeFi, SaaS stocks). 3. The agent reads tickers from the sheet, looks up prices on predefined sites, and writes back caps and notes (e.g., “>10% move since yesterday”).Because Simular emphasizes **transparent execution**, every click and keystroke is inspectable. You can open an execution trace to see **exactly** how the agent updated each Google Sheet or Excel file—no black boxes.### 3.3 Integrating with your wider workflowTie it all together via Simular’s webhook integration:1. Trigger the agent from your CRM or a simple HTTP call when a portfolio review is due. 2. The agent updates Sheets/Excel, exports PDFs, and drops them into Drive or email drafts. 3. Your team opens reports that are already calculated, formatted, and current.**Pros:** End-to-end, human-like automation; adapts when websites change; production-grade reliability over thousands of steps. **Cons:** Best suited when you have enough volume (many tickers, many clients, daily updates) to justify the agent’s setup.In short: start with manual formulas to understand the logic, layer in no-code to reduce clicks, then bring in a Simular AI agent when you’re ready to run market cap calculators across Google Sheets and Excel at true operational scale.

Heading 1

Heading 2

Heading 3

Heading 4

Heading 5
Heading 6

Lorem ipsum dolor sit amet, consectetur adipiscing elit, sed do eiusmod tempor incididunt ut labore et dolore magna aliqua. Ut enim ad minim veniam, quis nostrud exercitation ullamco laboris nisi ut aliquip ex ea commodo consequat. Duis aute irure dolor in reprehenderit in voluptate velit esse cillum dolore eu fugiat nulla pariatur.

Block quote

Ordered list

  1. Item 1
  2. Item 2
  3. Item 3

Unordered list

  • Item A
  • Item B
  • Item C

Text link

Bold text

Emphasis

Superscript

Subscript

Scale market cap calcs with an AI workflow guide now

Train Simular agent
Define a clear playbook: show your Simular AI agent how to open Google Sheets and Excel, locate tickers, pull prices from chosen sites, and apply price × shares formulas.
Test and refine runs
Run your Simular AI agent on a small watchlist first, review every logged action, tweak prompts and sheet layouts, and iterate until the first full market cap run is flawless.
Delegate and scale
Schedule the Simular AI agent to update all market cap sheets on a cadence, fan out across clients and portfolios, and let it own the repetitive refresh and reporting work.

FAQS