
Oops! Something went wrong while submitting the form.
.svg)
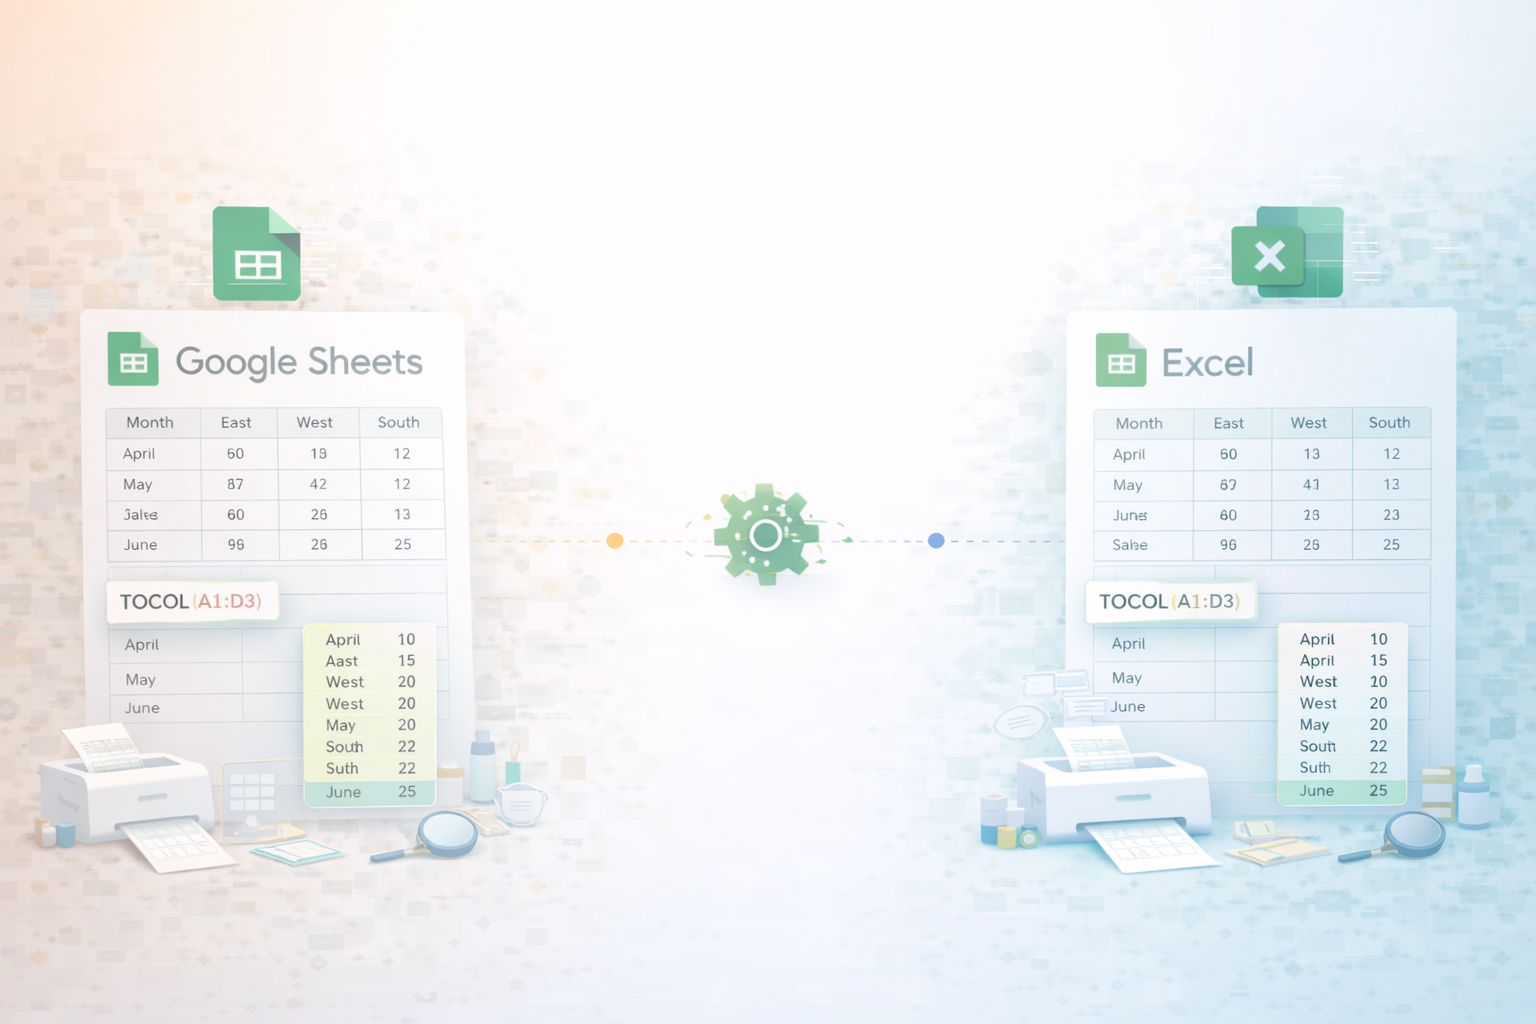
TOCOL is one of those quiet functions that unlocks real leverage. In Excel it takes any two‑dimensional range—campaign by channel, product by region, rep by month—and spills it into a single clean column. That one column is much easier to filter, sort, de‑duplicate, score, and feed into your models or dashboards. In Google Sheets, you can mirror the same pattern with FLATTEN and array formulas, so every pivot table, report, or revenue forecast starts from a tidy, linear dataset instead of a maze of cross‑tabs.
Where this really compounds is when an AI computer agent sits on top of the workflow. Instead of you copying ranges, rewriting TOCOL formulas, and fixing #VALUE! errors, the agent can open Excel or Sheets, apply TOCOL (or the equivalent), normalize data, rerun UNIQUE and SORT, and log what changed. You move from remembering formulas to simply asking: Every morning, flatten yesterday’s exports and update my master lead list.
If you work in sales, marketing, or at an agency, you live in spreadsheets. Campaigns by channel, territories by rep, SKUs by region – everything ends up in a grid. The problem is that most tools downstream (CRMs, BI tools, AI models) want clean, single‑column lists. That’s exactly what Excel’s TOCOL function – and TOCOL‑style patterns in Google Sheets – are for.
Below are three layers of sophistication: from manual, to no‑code, to fully agentic automation.
Use this when you have a tidy 2D range and just need it stacked into one column.
Microsoft’s official TOCOL documentation is at: https://support.microsoft.com/en-us/office/tocol-function-22839d9b-0b55-4fc1-b4e6-2761f8f122ed
TOCOL has an ignore argument:
Example for a messy export with errors:
=TOCOL(A2:D500,3)
This flattens your range into a single column and silently skips empty cells and error values (like #N/A) so you get a clean list.
For deduplicated, ordered lists:
=UNIQUE(SORT(TOCOL(A2:D500,3)))
This pattern is perfect for creating unique lead lists from multiple campaigns, consolidated product catalogs, or normalized UTM parameter sets.
If UNIQUE doesn’t seem to work after TOCOL (a common edge case), normalize the data first:
=LET(t,TOCOL(A2:D500,1), n,FILTER(VALUE(t),t<>""), UNIQUE(SORT(n)))
This coerces text numbers to real numbers and drops pseudo‑blanks before deduping.
Google Sheets doesn’t have TOCOL (yet), but you can get similar behavior using FLATTEN and array formulas.
See Google’s official function reference here: https://support.google.com/docs/table/25273
This gives you a single, stacked column you can use across dashboards and pivot tables.
Once TOCOL has spilled your list:
This is useful for one‑off analyses, list handoffs to SDRs, or importing into tools that don’t support dynamic arrays.
Once you’ve got repeatable patterns, you don’t want to be the one opening files every day. Here’s how to offload the busywork without writing code.
For Microsoft 365 users, Power Automate can run your TOCOL‑based flows on a schedule.
Typical pattern:
Reference on dynamic arrays and spilled ranges: https://support.microsoft.com/en-us/office/dynamic-array-formulas-and-spilled-array-behavior-64e5c57e-11c3-4b99-b5f2-ef20c45c0b68
Even if you’re not an engineer, a simple Apps Script can help refresh TOCOL‑style FLATTEN formulas.
Official Apps Script docs: https://developers.google.com/apps-script
No‑code integration tools like Zapier or Make can:
You’re still relying on spreadsheet formulas, but the ingestion of raw data is automated.
At some point, your workflows cross from simple to messy: multiple files, different layouts by client, dozens of little corrections that no formula or static integration fully captures. This is where an AI computer agent like Simular shines.
Simular Pro is a production‑grade computer‑use agent that can operate your entire desktop environment: open files, click through dialogs, type formulas, and integrate with browser‑based tools. Instead of you being the “glue” between exports and models, the agent becomes the glue.
Story: Every night, your SDR manager drops CSVs from three ad platforms into a folder. You used to:
With Simular:
Pros:
Cons:
For agencies juggling dozens of clients, each with their own report templates:
Pros:
Cons:
By combining strong spreadsheet patterns (TOCOL, UNIQUE, SORT, FLATTEN) with a desktop‑class AI computer agent, you move from “I have to remember how to clean this data” to “The system cleans it, I just review the story it tells.”
