
Oops! Something went wrong while submitting the form.

.svg)
If your team still budgets in scattered spreadsheets and ad‑hoc reports, Google Sheets is the fastest way to bring order to the chaos. It’s free, familiar to almost everyone, and built for collaboration. You can spin up a budget in minutes using templates, organize income and expense categories for your business, and layer on formulas, charts, and conditional formatting to see exactly where money is flowing. For owners, agencies, and marketers, that means one live source of truth for ad spend, retainers, SaaS tools, and payroll—no more chasing screenshots from finance.
Where it breaks down is the grunt work: downloading bank statements, cleaning CSVs, pasting into Google Sheets, fixing broken formulas, refreshing charts, and sending weekly summaries. That’s where an AI computer agent steps in. Instead of you babysitting the sheet, the agent logs in, updates data, categorizes spend, checks for anomalies, and ships a clean summary before you wake up. You keep control of the rules; the AI does the clicking, typing, and dragging at scale.
Manual doesn’t have to mean messy. Here’s how to build a solid, traditional budget in Google Sheets that your team will actually use.
Step 1: Create your budgeting spreadsheet
2025 Marketing & Ops Budget.
Step 2: Set up categories that match your business Create rows for major sections:
Keep it simple first; you can always split categories later. This mirrors best practices from common templates: clear income, expense, savings sections.
Step 3: Decide your budget period and layout Most businesses budget monthly. Create columns:
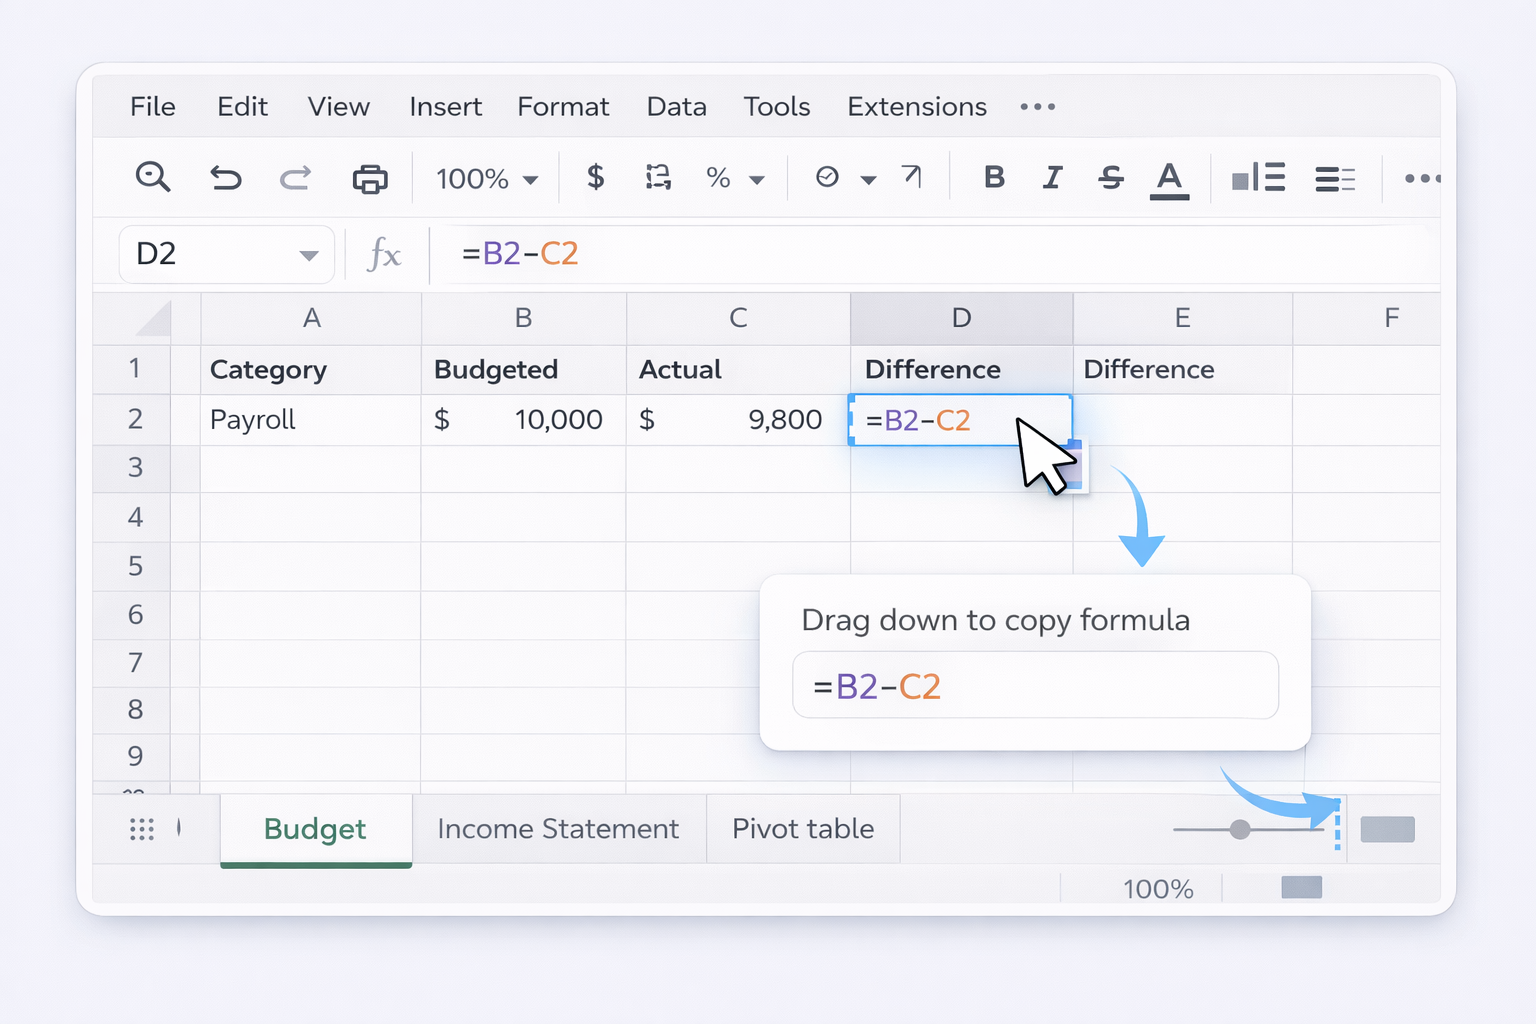
Budgeted - Actual)Formula for D2, then drag down:
=D2 = B2 - C2
Google explains basic formulas here: https://support.google.com/docs/answer/3094284.
Step 4: Add totals and net profit Below your last income row, add:
=SUM(B2:B10) (adjust range) Below your last expense row, add:=SUM(B15:B40)=Total Income - Total ExpensesYou can learn more about SUM and other functions here: https://support.google.com/docs/answer/3093197.
Step 5: Use conditional formatting to flag issues Make overspending impossible to ignore:
Less than 0 → fill red.Greater than or equal to 0 → fill green. Docs: https://support.google.com/docs/answer/78413.Now your team can see in seconds which campaigns or tools are bleeding budget.
Step 6: Visualize with charts Turn raw numbers into a story:
Add a second chart showing net income by month if you’re tracking multiple months on separate tabs.
Step 7: Protect your formulas To stop accidental overwrites:
Now sales or account managers can update numbers without breaking your budget logic.
Once the structure is solid, your bottleneck is data entry. Here’s how to reduce manual work without writing code.
Method 1: Streamline imports from bank CSVs
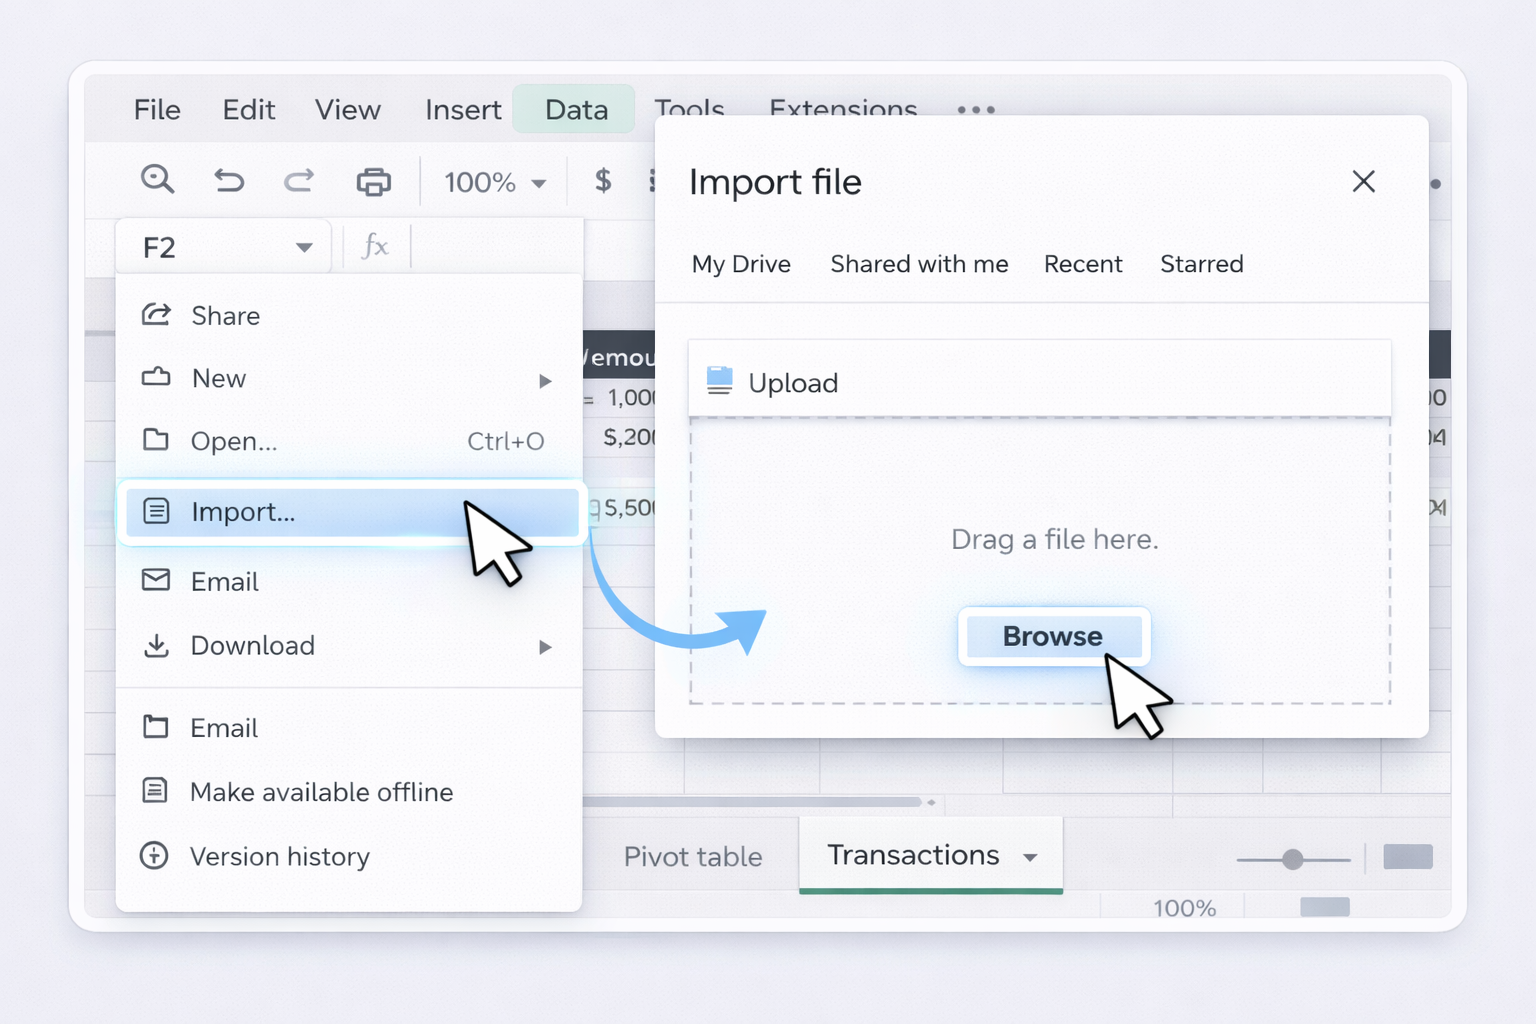
Add a header row with Date, Description, Amount, Category, Account. Then use:
=SUMIF(CategoryRange,"Facebook Ads",AmountRange) to total a channel’s spend.
Method 2: Use data validation for clean categories Instead of free‑typing categories:
Now anyone logging expenses must choose from the same clean set of categories.
Method 3: Capture expenses with Google Forms For agencies or teams on the road:
=IMPORTRANGE(). Docs: https://support.google.com/docs/answer/3093340.Every submitted expense flows straight into Sheets—no chasing receipts by email.
Method 4: Use QUERY for quick analysis QUERY gives you SQL‑style reports:
=QUERY(Transactions!A:E,
 "select C, sum(D) where A >= date '2025-01-01' and A <= date '2025-01-31' group by C",1)
This returns spend by category for January. Learn QUERY here: https://support.google.com/docs/answer/3093343.
You can turn these results into dashboards your leadership actually reads.
At some point, even no‑code automation still leaves you or your ops manager clicking through the same rituals: logging into banks, downloading CSVs, tidying columns, updating charts, emailing summaries. This is where an AI computer agent like Simular Pro becomes your behind‑the‑scenes finance assistant.
Simular Pro can operate your whole desktop—browser, Google Sheets, downloads folder—just like a human, but with production‑grade reliability. Learn more here: https://www.simular.ai/simular-pro.
AI Method 1: End‑to‑end monthly close in Google Sheets You define the playbook, Simular runs it:
Pros
Cons
AI Method 2: Continuous budget monitoring and alerts Simular can "live inside" Google Sheets and your browser as a watcher:
Pros
Cons
AI Method 3: Client‑ready reports for agencies and consultants For agencies managing many client budgets in separate Google Sheets:
Pros
Cons
Because Simular combines LLM flexibility with symbolic control, you get an agent that can handle messy real‑world UI but still run repeatable, long‑horizon workflows. You stay in control of the logic; the agent takes over the keyboard and mouse.
